Navigate Here: Reports > Analytics Management > Add Analytics Report
You can add an analytics report on the Add Analytics Report page. For example, you can add a Project Expenses analytics report.
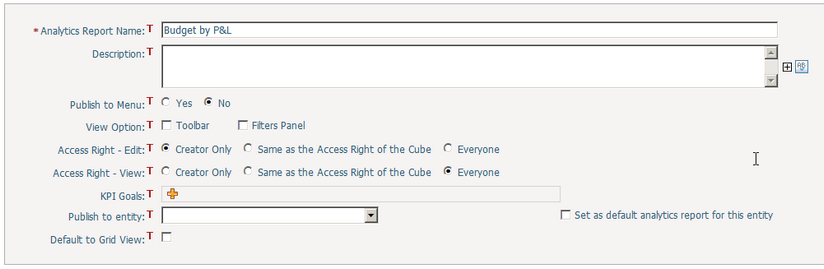
Fill in the fields in the General Information section.
|
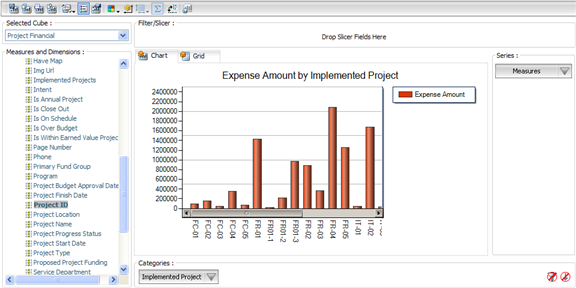
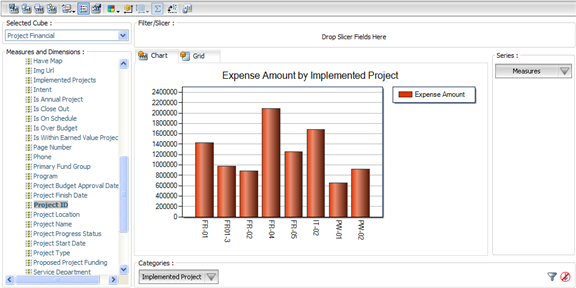
Select Project Financial from the Cube panel. The measures group and dimensions of this cube will be loaded in the Measures and Dimensions panel.
|
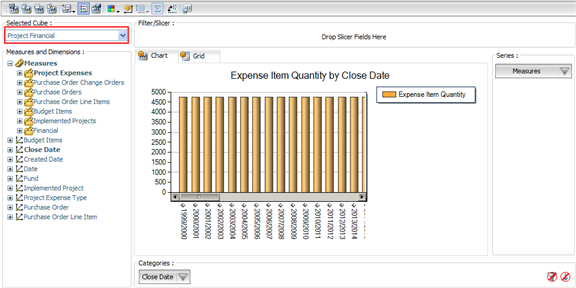
The Series selected by default is Measures -> Project Expenses -> Expense Item Quantity and the Categories selected by default is Close Date -> Close Date.Fiscal Year – Fiscal Month – Fiscal Day. The selected Dimensions (Attributes) and Measures are bold.
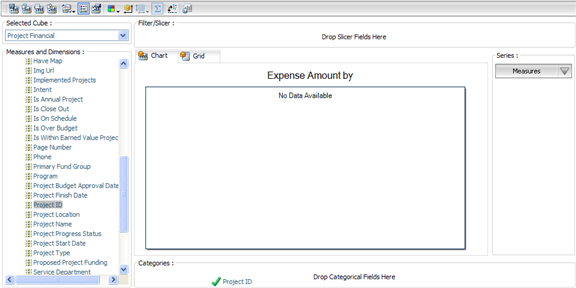
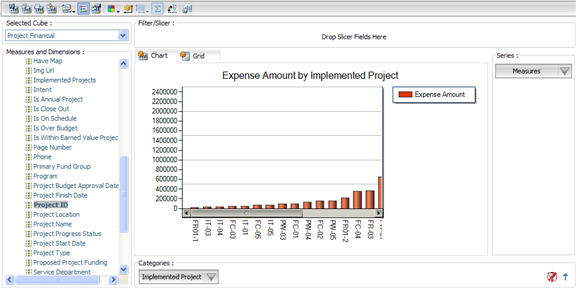
Drag the dimension Close Date in the Categories panel and drop it into Measures and Dimensions panel to remove it from Categories panel and drag Implementation Project.Project ID from Measures and Dimensions panel to Categories panel.
Click
Click
Toolbar in the edit window:
Data of the selected categories and series will be shown in Chart Mode by default. You can switch it to Grid Mode by clicking on the Chart/Grid tab.
|
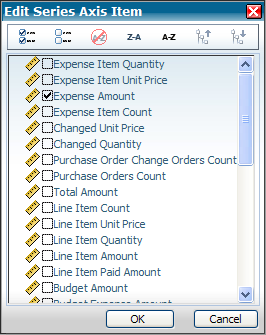
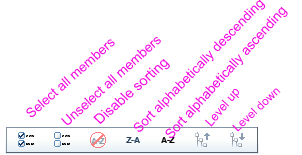
Use the buttons
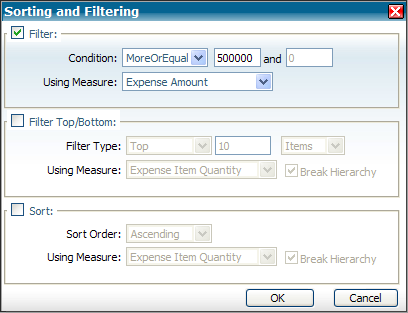
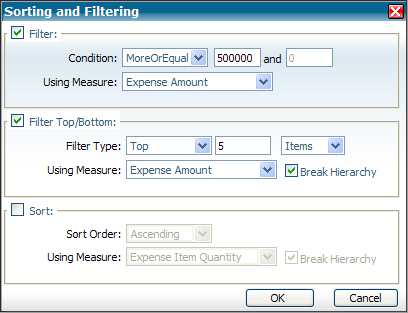
You can click on
The system will only show the Expense Amount which is equal to or more than 500,000 will be shown in the output chart.
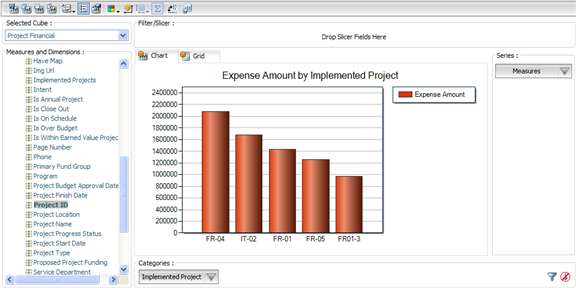
On the other hand, you can set the filter to display only the top 5 expenses:
You will see the chart showing only the top 5 columns:
Filtering is useful when there may be too many columns or there are some unimportant data (e.g. the value of zero).
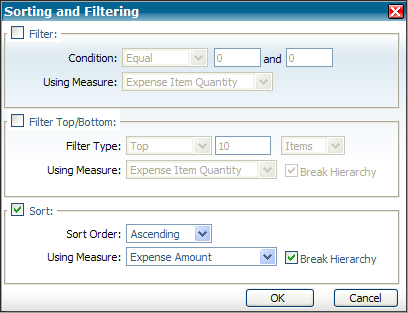
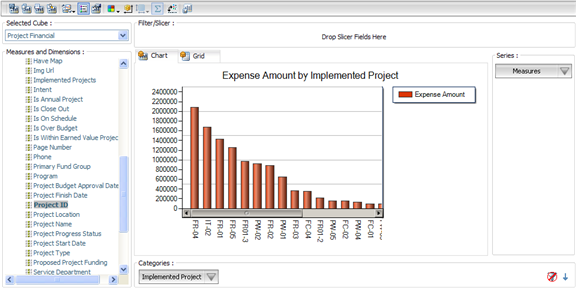
You can use the Sort option to set a default measure (when more than one measures are used in this report) and sort it by ascending or descending order.
You can also use
Ascending:
Descending:
Note that the Filtering and Sorting also take effect in Grid Mode. |
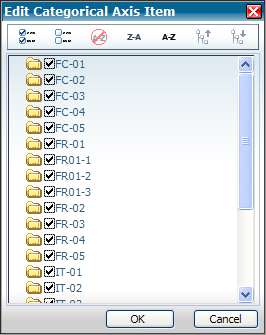
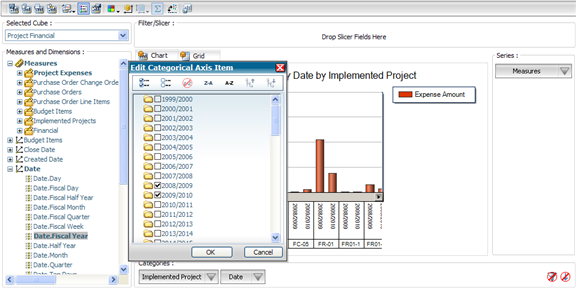
Add Date to the Categories panel and select the date you want to be included:
You can also change the dimension order by drag and drop them in the Categories panel.
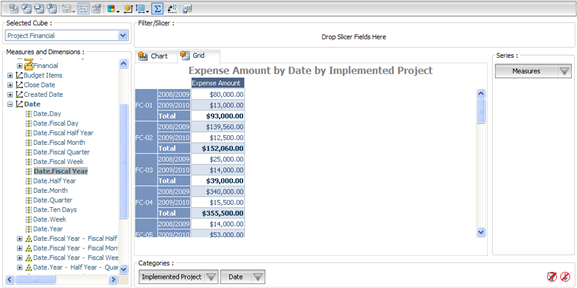
This will also take effect in Grid Mode:
|
Click the Save button to save the report when the report is done.
Click the Cancel button to withdraw the operation and return to Browse Analytics Reports page.