Navigate Here: Reports > Analytics Management > Add Analytics Report
You should have a basic understanding of the Manage Analytics Report page before you proceed further on Analytics Report.
The page is divided into two sections: General Information and Report Design.
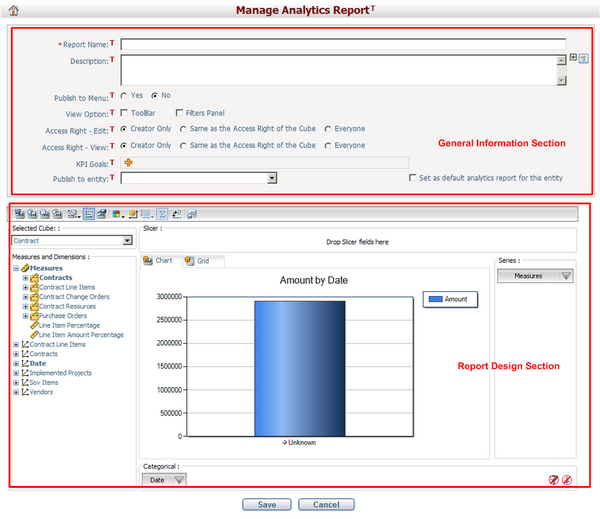
To complete the General Information section, fill in the following fields:
The required fields are noted with an asterisk (*).
Report Name*: The name of the analytics report. It must be unique. Report name will be the page heading of View Analytics Report page. If the report is published to menu, report name will be the menu item name.
Description: Description of the report.
Publish to Menu: You can select whether to publish this report to the menu. If you select Yes, the report viewer can view the report from the menu entry: Reports > Analytics Reports > Cube Name > Report Name.
View Options: There are two options for display on the View Report page: Toolbar and Filters Panel.
Access Right – Edit and Access Right – View: They each have three options:
•Creator Only – Only the user who created the report has the right. •Same as the Access Right of the Cube – Only the users who have data access right on the cube, from which the report is made from to have the access right to the report. The prerequisite is Cube Data Access Control. •Everyone – All users have the right.
Users that have editing right must have viewing right. The user set for viewing must be equal or greater than the user set for editing. For example, if Access Right – Edit is According to Cube Access Right, Access Right – View can only be either According to Cube Access Right or Everyone. The default value of Access Right – View is Creator Only. The available values of Access Right – Edit are determined by Access Right – View. When an option is selected for Access Right – View, only the options which are equal or lower than that are available for Access Right – Edit.
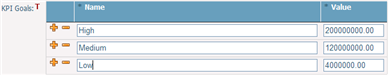
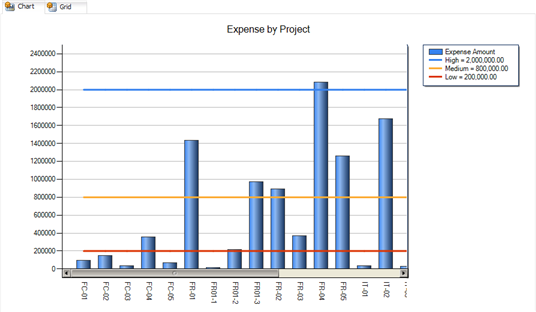
KPI Goals: KPI is short for Key Performance Indicator. You can specify a goal, which is a value, for the measure of the analytics report and the goal will be displayed in the chart in the View Report mode.
Click the Add icon
For example, if the KPI Goals are filled in as shown above, you can see the indicators in the chart in the View Report mode below:
Publish to Entity: If you select an entity to publish the analytics report, a tab page named “Analytics Report” will appear on the entity selected and the analytics report will be displayed in the dropdown list on this tab page.
|
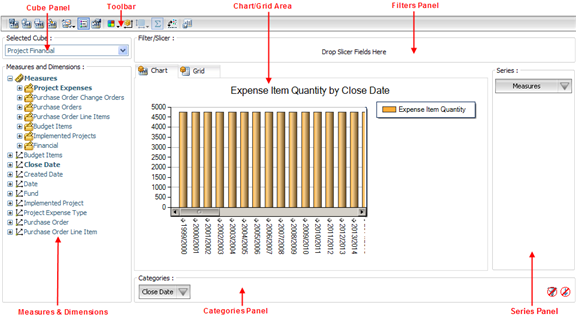
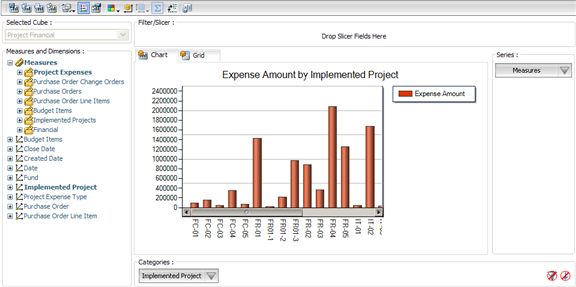
The picture below illustrates the components of the Report Design section:
Cube Panel
The Cube Panel lists all pre-defined cubes in the CIPAce system, including: Contract, Fund, Fund Allocation, Fund Group, Implementation Project, Issue, Planning Project, Project Budget, Project Expense, Project Filtering, Project Financial, Project Portfolio Planning, Project Ranking, Project Resource and Schedule, Project Risk and Issue, Project Scoping, Proposal, Purchase Order, Resource, Risk, Task, Timesheet, Project Tracking. You need to select one of the pre-defined cube in the Cube Panel before you begin to design the report. After selecting a cube, the pre-defined measures and dimensions will be displayed in the Measures and Dimensions Panel. (Please note that "Project Tracking" is currently the only cube that supports displaying financial amounts in multiple currencies.)
Measures and Dimensions Panel
A measure is a fact, which is a transactional value or measurement that a user may want to aggregate. Measures are sourced from columns in one or more source tables, and are grouped into measure groups. Each measure group has a pre-defined default attribute. When select a measure group is selected, its default attribute is automatically selected. For example, the default attribute for Project Expenses would be Expense Item Quantity. A dimension is a group of attributes that represent an area of interest related to the measures in the cube, and which are used to analyze the measures in the cube. Generally, the attributes of a dimension will be all of the fields in a data table. For example, Project may include Project ID, Project Name, Department, Program, Account Number, Contact Person, and so on. Each dimension has a pre-defined default attribute. When select a dimension is selected, its default attribute is automatically selected. For example, the default attribute for Project would be Project ID – Project Name.
Categories Panel
A chart category group is similar to a matrix dynamic column group. Normally categories are dimensions.
Series Panel
A chart series group is similar to a matrix dynamic row group. Normally series are measures.
Categories and Series in Grid Mode:
Chart/Grid Area
The data generated by the Categories and Series is displayed in the Chart/Grid Area in chart/grid mode. You can switch between chart and grid modes by clicking the Chart/Grid tabs.
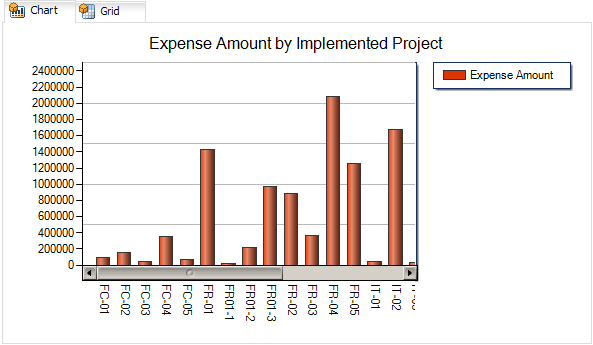
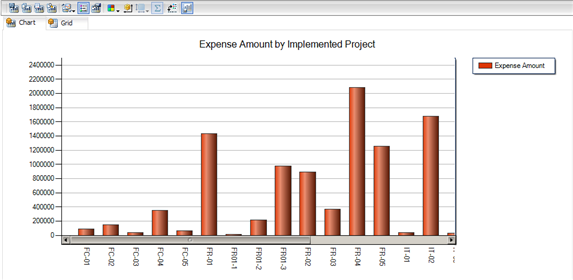
Chart Mode:
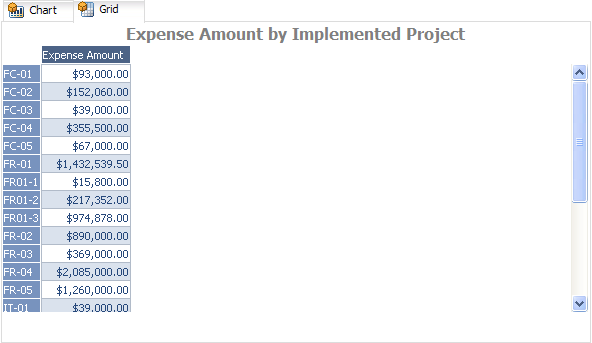
Grid Mode:
Filter Panel
A filter can be a dimension or an attribute of a dimension and the filter is applied in the View Report mode to let the report viewer filter the output chart/grid.
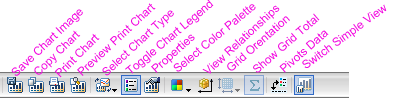
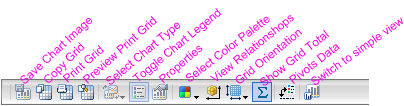
Toolbar
The Toolbar changes in the Chart/Grid Mode.
|