Navigate Here: Reports > Analytics Management > Browse Analytics Reports; click the View icon or Reports > Analytics Reports > Cube Name > Report Name
You can view the analytics report designed by the report designer on the View Analytics Report page. By default, it is display in Chart Mode. You can switch between modes by clicking on the Chart/Grid tab.
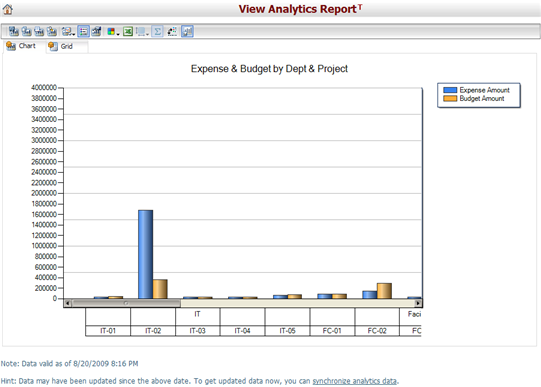
Data valid time displays on the bottom of the chart/grid and it is the Last Synchronization Finish time of the corresponding cube of the report. You can also go to the Synchronize Analytics Data page by clicking the synchronize analytics data link.
You can see the Toolbar and the KPI indicators if they are defined by the report designer.
The toolbar is similar to the one on the report design screen, with the addition of the Excel ![]() icon. You can click on this icon to export the data of this report to a Microsoft Excel file.
icon. You can click on this icon to export the data of this report to a Microsoft Excel file.
Important Notes: if you are viewing an analytics report that displays financial amounts in multiple reporting currencies, please be noted that (a) project scoping amounts use projected exchange rates in the system default projected exchange rate set for currency converting; (b) project budget amounts use actual exchange rates of which "Effective Date" match the Budget Effective Date of budget line items for currency converting; (c) project expense amounts use actual exchange rates of which "Effective Date" match the Cost Date of expenditure items for currency converting.