Navigate Here: Reports > Tracking Reports > Projects Schedule Report
Project Schedule Report is a report showing project schedule tasks in a Gantt chart.
Note: Only Approved project schedules will be included in this report.
You can configure the below settings before viewing the report. These settings will affect the content and layout of the report.
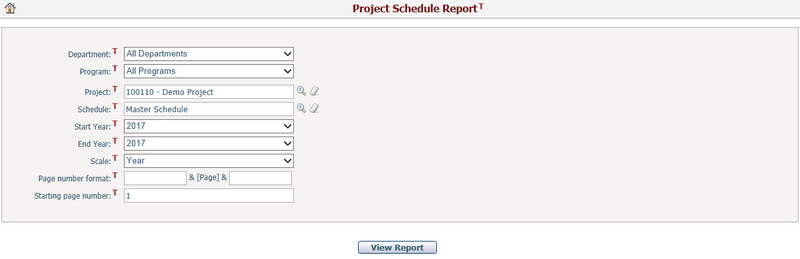
Department: Select whether to contain projects in all departments or only in a specific department. Then it will filter the Project list.
Program: Select whether to contain projects in all programs or only in a specific program. Then it will filter the Project list.
Project: Select whether to contain all projects or only a specific project.
Schedule: Select the schedules under the select projects.
Start Year: Select a starting year of the Gantt Chart in the report. The options will be the years contained in the project schedule tasks.
End Year: Select an end year for reporting period, and the system will check if there is any project schedule task falls into the period from Start Year to End Year. If no task is found, the report will not be printed. The options will be the years contained in the project schedule tasks.
Scale: Select the best scale to fit the Gantt chart. You can select Year, Half Year, Quarter, or Month.
You can set the Page Number Format and the Starting Page Number in the report. The Page Number Format allows you to enter text, symbols, or numbers to help display the page numbers on the report. For example, if you wanted to include the word “Page” before each number you would enter this in the first format text box. The page numbers would appear as “Page 1”, “Page 2”, etc. The Starting Page Number allows you to modify the starting page on your report. This is used for display purposes only, and will not affect the output of the report. The default starting page number is 1.
Once you have finished, click the View Report button to open the report in a new window. The report will be opened in PDF format and you can use the PDF view functions by clicking the buttons in the tool bar.
Below are the descriptions of the content contained in the table of this report:
Project ID: This is the Project ID field on the Project General Information form.
Project/Schedule/Task Name: The projects, schedules, summary tasks and sub-tasks in hierarchy by their names.
Budget: It is the UTD budget amount of the project.
YTD Exp.: It is the UTD expenses in all types of the project but the expenses have to be approved.
Start: The planned start date of the project schedule or the start date of the task. For project, this column will be blank.
Finish: The planned finish date of the project schedule or the finish date of the task. For project, this column will be blank.
Duration: The duration of the task, for project and schedule, this column will be blank.
Gantt Chart : The rest of the table shows the projects' tasks proceeding status in a time period by Gantt Chart. You can set the time period to be by year, by half year, by quarter or by month in the dropdown list on the top left corner of the report. The black portion of the Gantt Chart represents the completed part of the task and the gray portion represents the unfinished part of the task.
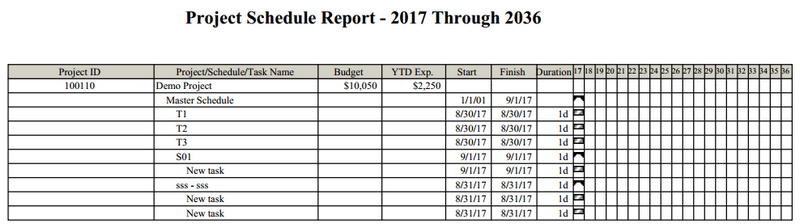
Note: For a master schedule, all its sub schedules (no matter selected or not) and their tasks will be included in the master schedule task hierarchy structure.