Navigate Here: Workspace > My Dashboard
My Dashboard is where you view and access the summary data and graphical reports predefined in the different dashboard templates, and you can customize it for your own purpose.
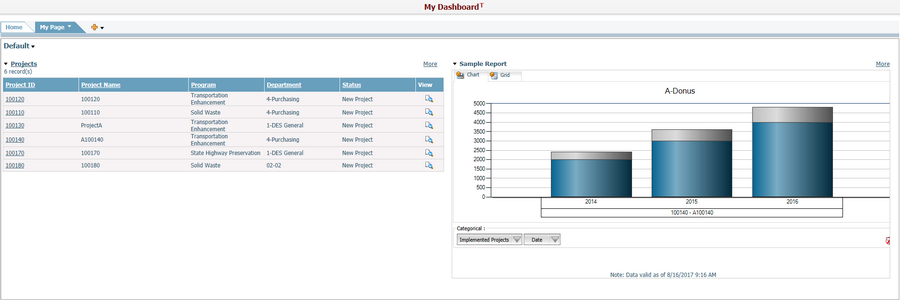
Click the names of tab pages to navigate between different tab pages.
Every time when you log into the system, the last tab page you have visited will be opened by default, and if there are new or updated tabs published from a "Copy" type dashboard profile template, the following pop-up message will be displayed. On the contrary, the "Reference" type dashboard profile template will automatically applied to your dashboard once published.
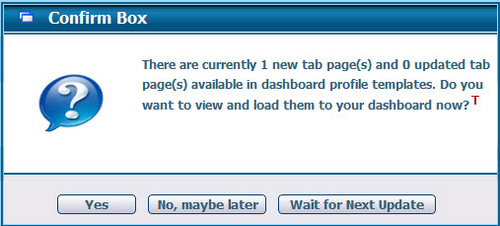
Click the Yes button if you want to view and load the new tab pages immediately, and the Load Tab Page from Template or View dialog will ask you to select the tab pages you want for your dashboard.
Click the No, maybe later button, and the confirm box will be closed. It won't pop up until you log into the system next time.
Click the Wait for Next Update button if you don't want to load any new tab pages now. The confirm box will be closed, and it won't pop up until there is a new version of dashboard profile template published to you again.
The dashboard hierarchy is composed of Tab Pages > Sections > Workboxes as shown in the sample below. A workbox is the basic component to display the detail information. There are different types of workboxes to be configured and displayed in your dashboard:
Data Workbox
It is a summary of multiple projects' information by the specific filtering conditions.
You can click the underscored name of the workbox to open the browse page of the related business entity.
You can click the underscored data (e.g. ID or Name) or View icon ![]() of a data record to open the general page of the selected record.
of a data record to open the general page of the selected record.
You can click the More link at the top right corner to browse more records in a full screen mode. In this mode, you can download the data in the same structure of the workbox by clicking the Export Data icon ![]() .
.
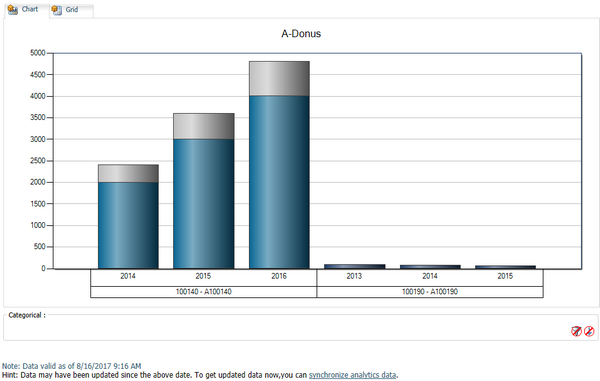
Report Workbox
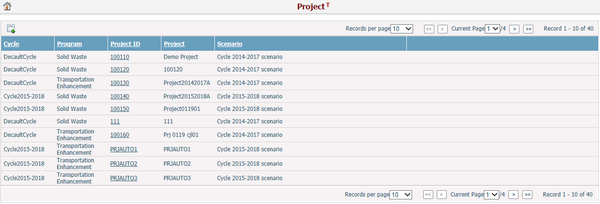
It is a graphical report for specific analysis purpose.
You can switch the view of the report between Chart and Grid or change the filtering conditions, all these actions will depend on how the analytics report has been configured.
You can click the More link at the top right corner to view the report in a full screen mode. In this mode, you can synchronize the report data by clicking the "synchronize analytics data" link at the bottom line.
Workflow Tasks
It is a summary of workflow tasks of different types - New, Processed, Completed by the specific filtering conditions.

You can click the underscored task name to open the business entity page with the specific workflow instance.
Favorite Links
It is a list of favorite links, you can click the underscored link name to open it in your explorer.

Inbox/Outbox
It is a list of inbound or outbound notifications by the specific filtering conditions.

You can click the underscored name of the workbox to enter Inbox or Outbox directly.
You can click the View icon ![]() at the end of each row to view the notification detail.
at the end of each row to view the notification detail.
You can click the More link at the top right corner to browse more records in a full screen mode. In this mode, you can download the data in the same structure of the workbox by clicking the Export Data icon ![]() .
.
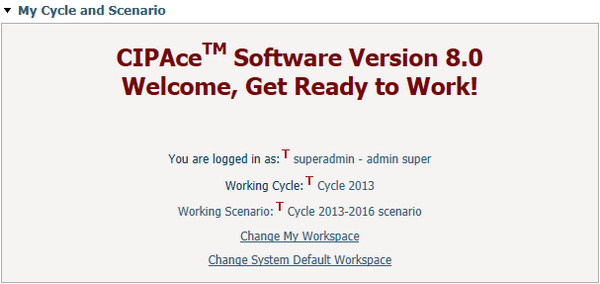
My Cycle and Scenario
It is a noticeboard of the working cycle & scenario information of the current user. You can change your own workspace or system default by clicking the links at the bottom.
Embedded Webpage
It is an embedded webpage.
