Navigate Here: Projects > Browse Projects; select a project > Implementation tab > Schedules tab, click View Single Gantt Chart icon ![]() at the column "View Gantt Chart"
at the column "View Gantt Chart"
In a single schedule Gantt Chart, user can manage all schedule tasks, resources, predecessors and other elements through a graphical view.
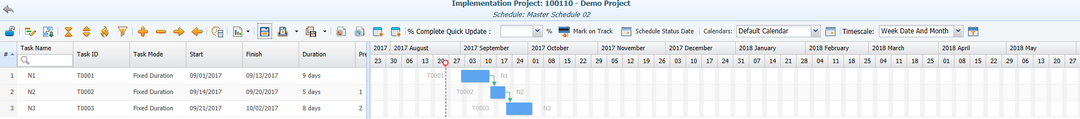
The schedule Gantt Chart is comprised of the following components:
Title Bar
The current Project ID - Name and Schedule Name are displayed as main and subtitles, respectively.
You can click Return to Schedule List icon ![]() to go to the Schedules tab under Project Management page without saving any updates to the current schedule tasks.
to go to the Schedules tab under Project Management page without saving any updates to the current schedule tasks.
Tool Bar
You can use the following tools to manage the schedule and tasks.
View Only Mode icon ![]() : Click it to unlock the current schedule for editing, and then the icon will be changed to Edit Mode icon
: Click it to unlock the current schedule for editing, and then the icon will be changed to Edit Mode icon ![]() .
.
Edit Mode icon ![]() : Click it to lock the current schedule for viewing only, and then the icon will be changed to View Only Mode icon
: Click it to lock the current schedule for viewing only, and then the icon will be changed to View Only Mode icon ![]() .
.
Edit Schedule General icon ![]() : Click it to open the Edit Schedule General page to edit the schedule general information.
: Click it to open the Edit Schedule General page to edit the schedule general information.
Load Sub Schedules icon ![]() : Click it to load sub schedules into the current schedule, and the current schedule will change into Master Schedule Mode immediately.
: Click it to load sub schedules into the current schedule, and the current schedule will change into Master Schedule Mode immediately.
Collapse All icon ![]() : Click it to collapse all sub-tasks under their parent tasks.
: Click it to collapse all sub-tasks under their parent tasks.
Expand All icon ![]() : Click it to expand all sub-tasks under their parent tasks.
: Click it to expand all sub-tasks under their parent tasks.
Highlight Critical Path icon ![]() : Click it to highlight a series of tasks based on Longest Path method that determines the schedule's completion time in the Gantt Chart.
: Click it to highlight a series of tasks based on Longest Path method that determines the schedule's completion time in the Gantt Chart.
Filtered By icon ![]() : Click it to pop up the "Filtered by" screen to define task filtering rules.
: Click it to pop up the "Filtered by" screen to define task filtering rules.
Add Task icon ![]() : Click it to add a new task to the bottom of all tasks.
: Click it to add a new task to the bottom of all tasks.
Remove Task icon ![]() : Click it to delete the selected tasks from the Task Grid.
: Click it to delete the selected tasks from the Task Grid.
Indent Task icon ![]() : Click it to indent the selected tasks and all their sub-tasks to a lower level.
: Click it to indent the selected tasks and all their sub-tasks to a lower level.
Outdent Task icon ![]() : Click it to outdent the selected tasks and all their sub-tasks to a higher level.
: Click it to outdent the selected tasks and all their sub-tasks to a higher level.
Reschedule Tasks icon ![]() : Click it to Reschedule Tasks based on their predecessor relationships.
: Click it to Reschedule Tasks based on their predecessor relationships.
Reports icon ![]() : Click it to display the schedule report list, and you can select and print a report in the list.
: Click it to display the schedule report list, and you can select and print a report in the list.
Save icon ![]() : Click it to save the current schedule.
: Click it to save the current schedule.
Save as Schedule Baseline icon ![]() : Click it to pop up the "Save as Schedule Baseline" screen to save the current schedule as a new baseline. Besides it there is a dropdown menu icon with option "Manage Schedule Baselines", and you can click it to pop up the "Manage Schedule Baselines" screen to manage all baselines of the current schedule.
: Click it to pop up the "Save as Schedule Baseline" screen to save the current schedule as a new baseline. Besides it there is a dropdown menu icon with option "Manage Schedule Baselines", and you can click it to pop up the "Manage Schedule Baselines" screen to manage all baselines of the current schedule.
Save as Schedule Template icon ![]() : Click it to pop up the "Save as Schedule Template" screen to save the current schedule as a new template. Besides it there is a dropdown menu icon with option "Load from Schedule Template",and you can click it to pop up the "Browse Schedule Templates" screen to select an existing template to load from.
: Click it to pop up the "Save as Schedule Template" screen to save the current schedule as a new template. Besides it there is a dropdown menu icon with option "Load from Schedule Template",and you can click it to pop up the "Browse Schedule Templates" screen to select an existing template to load from.
Import from Microsoft Project icon ![]() : Click it to open the “Import from Microsoft Project” page and import tasks from a Microsoft Project file.
: Click it to open the “Import from Microsoft Project” page and import tasks from a Microsoft Project file.
Export to Microsoft Project icon ![]() : Click it to open the “Export to Microsoft Project” page and export the current schedule to a Microsoft Project file.
: Click it to open the “Export to Microsoft Project” page and export the current schedule to a Microsoft Project file.
Import from Primavera icon ![]() : Click it to open the “Import from Primavera” page to import tasks from a Primavera XML file.
: Click it to open the “Import from Primavera” page to import tasks from a Primavera XML file.
Export to Primavera icon ![]() : Click it to export the current schedule to a Primavera XML file.
: Click it to export the current schedule to a Primavera XML file.
Import from Excel icon ![]() : Click it to open the “Import Excel Data” page and import tasks from an Excel file.
: Click it to open the “Import Excel Data” page and import tasks from an Excel file.
Export to Excel icon ![]() : Click it to open the “Export Excel Data” page and export the selected project schedule tasks to an Excel file.
: Click it to open the “Export Excel Data” page and export the selected project schedule tasks to an Excel file.
% Complete Quick Update combo box: Choose a number (0~100) in the dropdown list or input one manually to update the % Complete of the selected tasks.
Mark on Track icon ![]() : Click it to calculate the % Complete of the selected tasks automatically based on the current calendar day or the schedule status date if it has just been updated.
: Click it to calculate the % Complete of the selected tasks automatically based on the current calendar day or the schedule status date if it has just been updated.
Schedule Status Date icon![]() : Click it to set the schedule status date for the current schedule, so it can be used by the Mark on Track function.
: Click it to set the schedule status date for the current schedule, so it can be used by the Mark on Track function.
Calendars dropdown list : You can change the current Schedule Calendar by selecting system or project calendars in the list.
Add/Edit Project Calendar icon ![]() : You can add or change the project calendar that is assigned to the current schedule as its Schedule Calendar.
: You can add or change the project calendar that is assigned to the current schedule as its Schedule Calendar.
Timescale dropdown list : You can change the timescale format of the Gantt Chart by selecting a timescale option in the list.
Today icon ![]() : Click it to go to today in the Gantt Chart.
: Click it to go to today in the Gantt Chart.
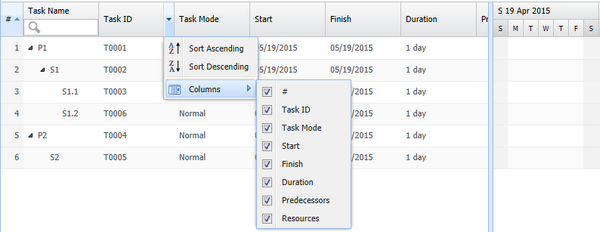
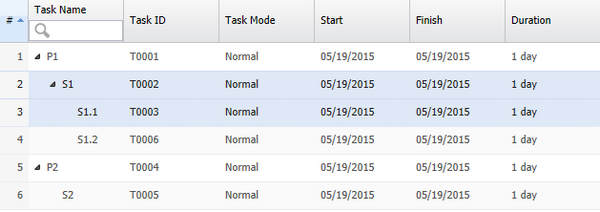
Task Grid
You can view all tasks in this grid with the selected attributes.
- You can click the column header to sort the tasks ascending or descending.
- You can change the view by hiding or showing different columns.
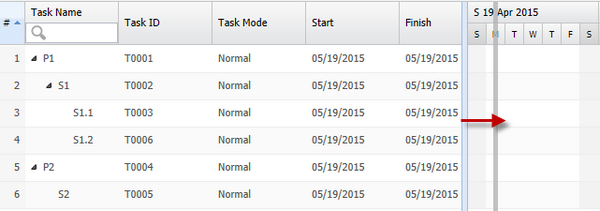
- You can drag the boundary line to show more columns.
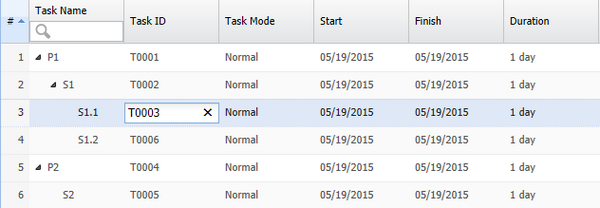
- You can double click a data cell to edit it directly.
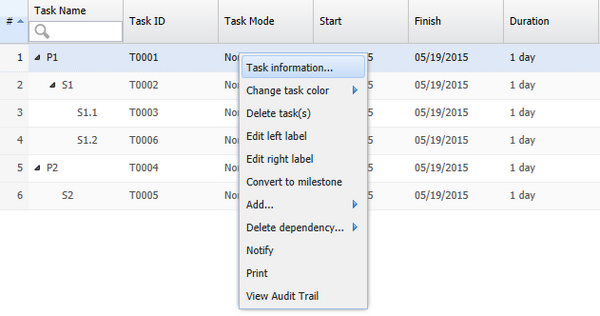
- You can right click a task to show the task menu.
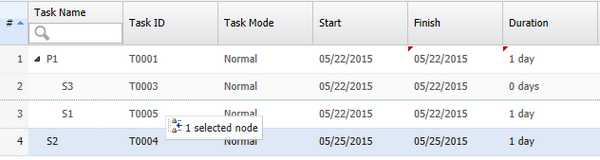
- You can select multiple tasks at the same time while pressing the SHIFT or CTRL key.
- You can drag one or multiple highlighted task(s) to move to other positions.
Gantt Chart
Tasks are displayed graphically as bars in this view.
- Summary and normal tasks are displayed as bars in different styles.
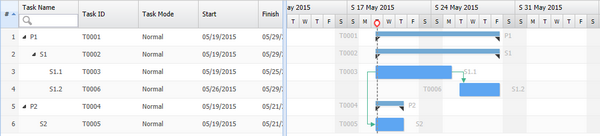
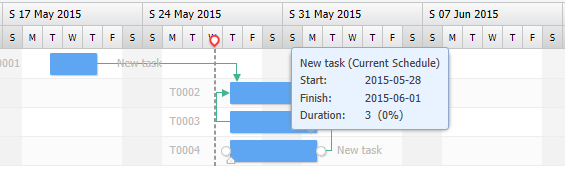
- When the cursor is hovering on the task bar, a floating window with task info will be shown.
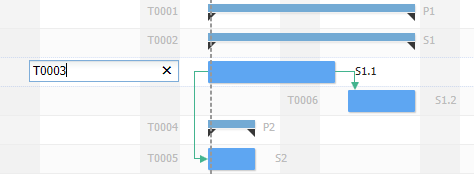
- You can edit the right/left labels of the task bars.
- You can move a task bar when the cursor is hovering on it and turning to a cross shape ![]() .
.
- You can drag the task start, end and % complete separately when the cursor is hovering on the task start/finish point and turning to a double arrow shape ![]() .
.
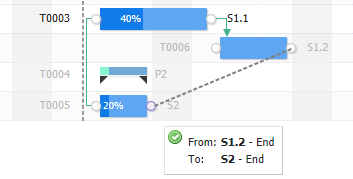
- You can create a predecessor relationship by drawing a dash line between two tasks when the cursor is hovering on the task start/finish point and turning to a hand shape ![]() .
.
- You can right click a task bar to show the task menu.
- You can double click a task bar to pop up the "Task Information" screen.